Search documentation
Find a documentation page by the words on it.
Documentation
Vitals and Flowsheets
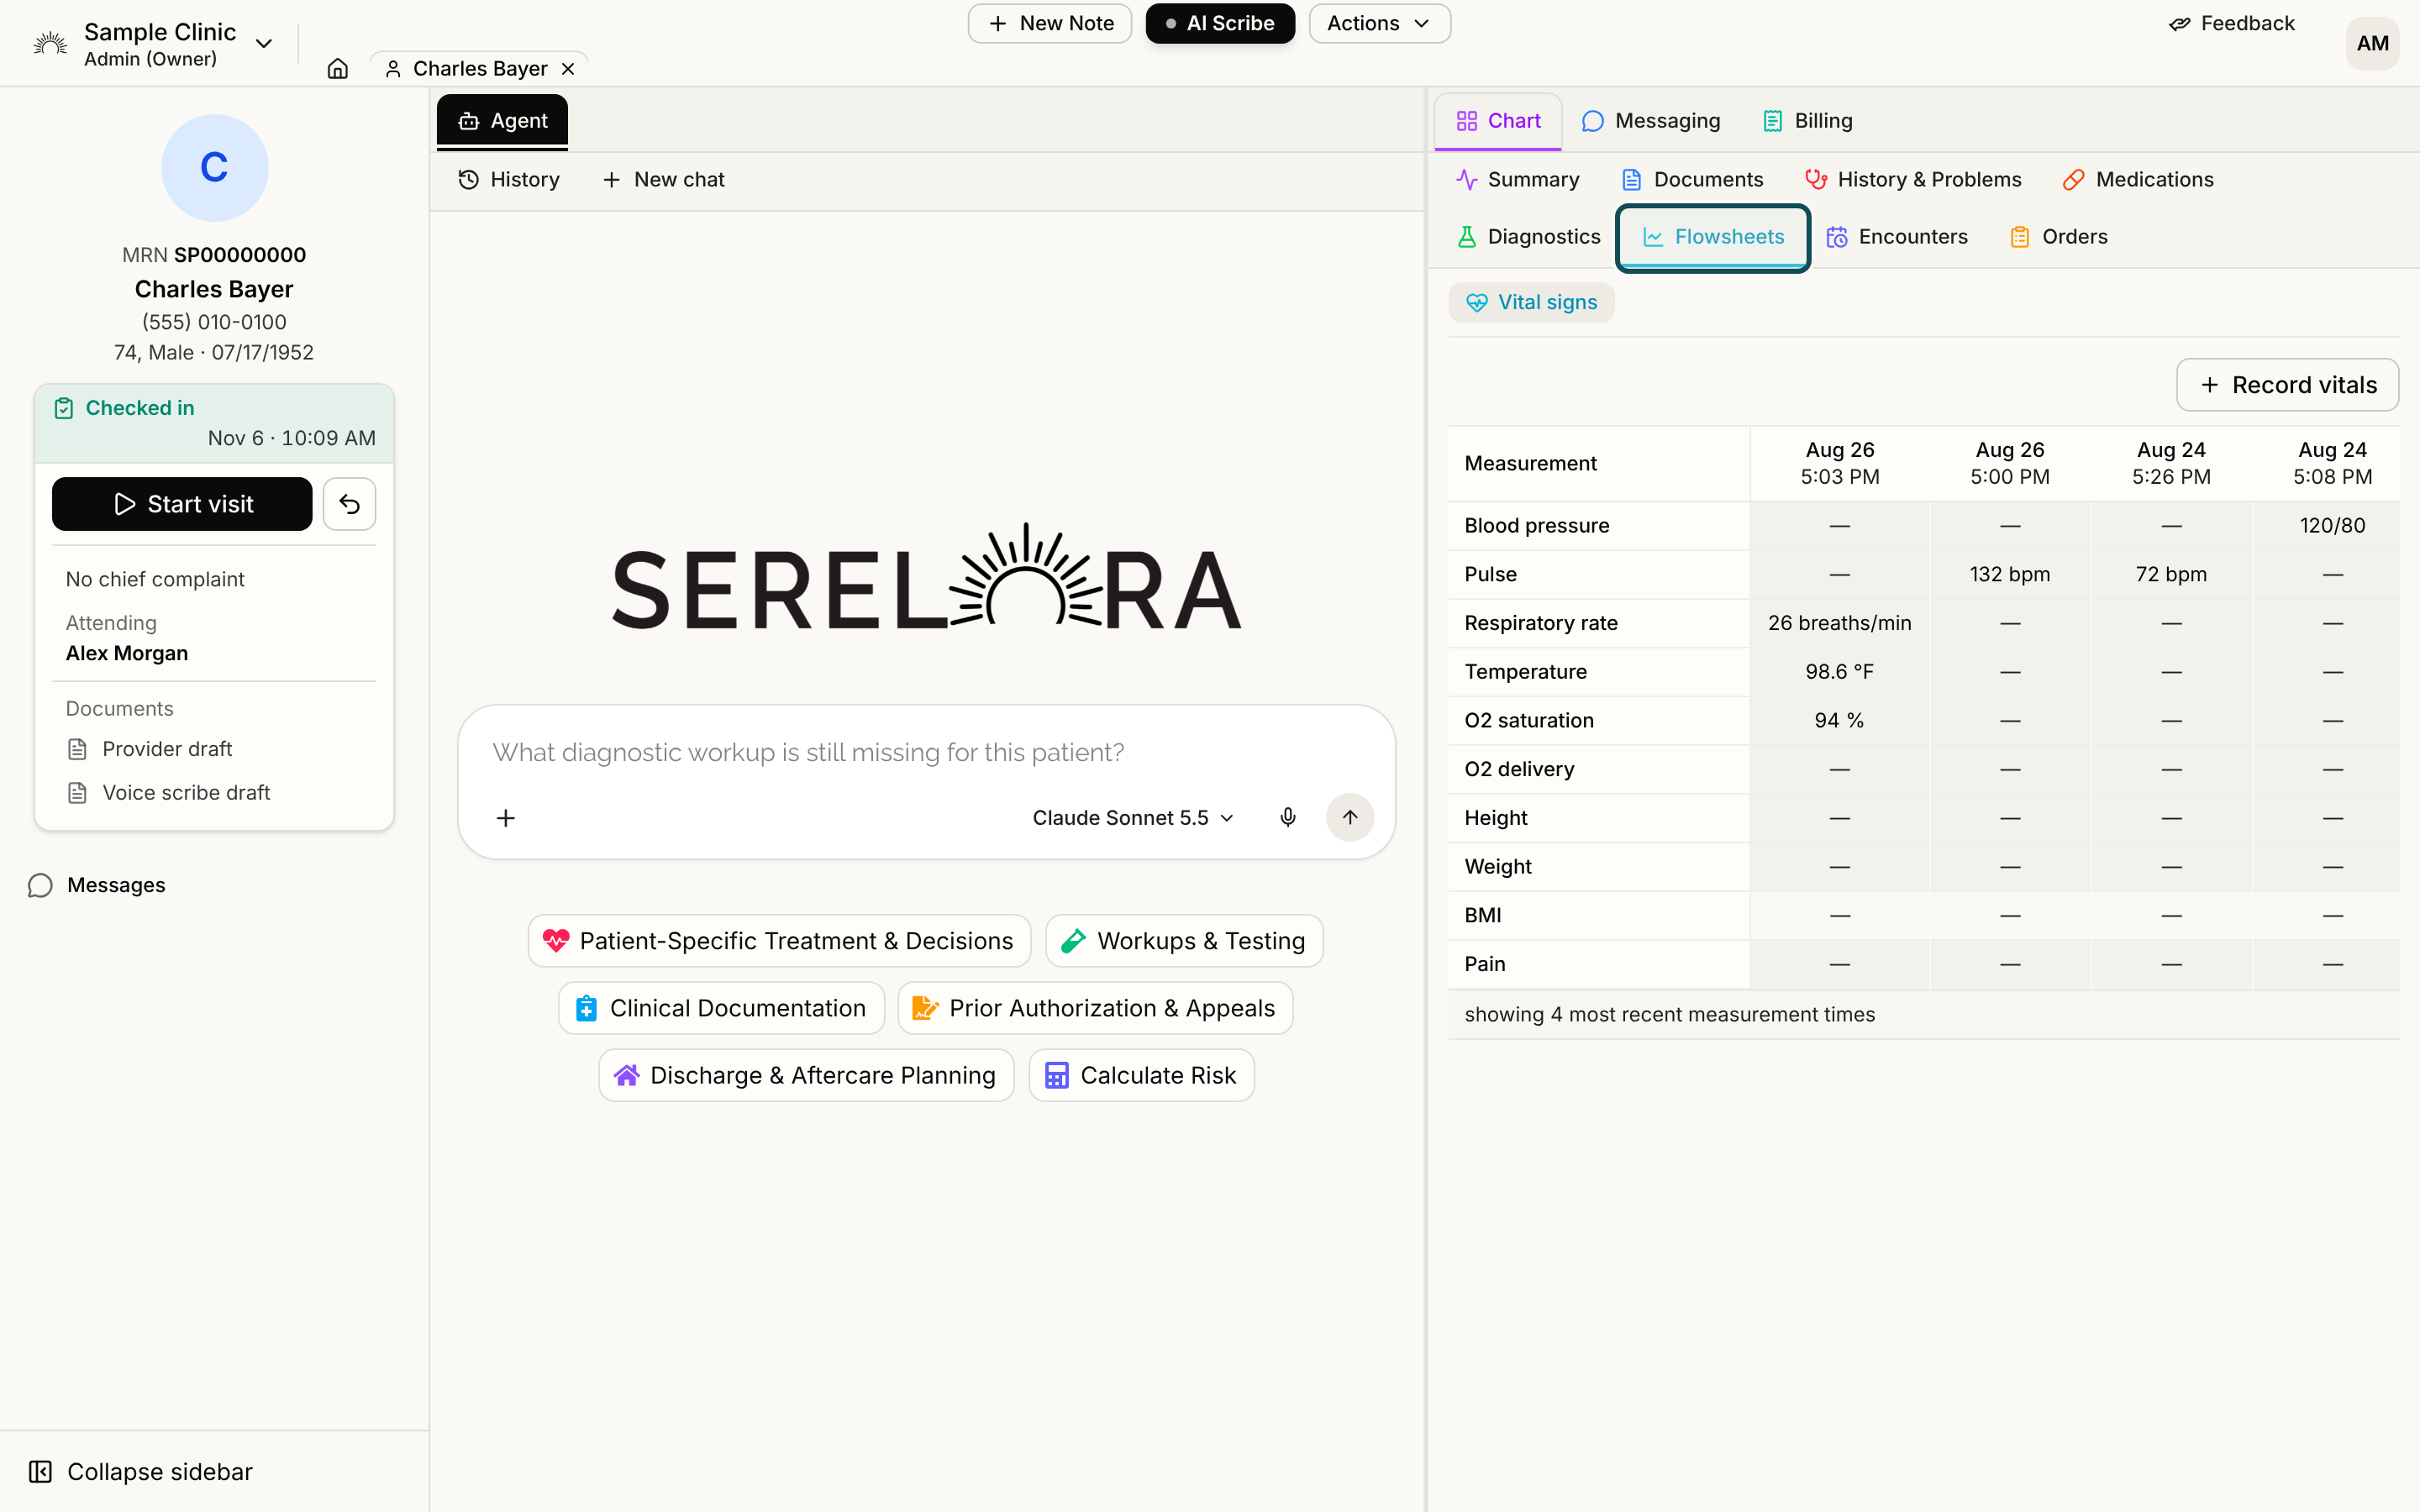
The Flowsheets tab shows a patient's vital signs as a grid: one row for each vital, one column for each time they were measured, newest on the left. Use it to see trends and to record new readings.
Everyone who can read the chart sees the tab. Recording and correcting readings is for roles that can edit the chart or record vitals: Admin, Physician, Physician Assistant and Medical Assistant by default.
Step 1: Open the flowsheet
Open the Flowsheets tab in the chart. It opens on the Vital signs sub-tab. You can also select Flowsheet in the header of the Summary tab's Vital Signs card.
The rows are Blood pressure, Pulse, Respiratory rate, Temperature, O2 saturation, O2 delivery, Height, Weight, BMI and Pain. Column headers show the date and time in the clinic's time zone. A dash means nothing was recorded for that vital at that time.
The grid starts with the ten most recent measurement times. A footer says how many are shown, and Load older adds ten more.
Height shows in feet and inches, weight in pounds and temperature in degrees Fahrenheit.
Step 2: Understand BMI
BMI is calculated, never typed. For a column that has a weight, Serelora uses that weight and the most recent height recorded at or before that time. The cell says calculated and shows the height it used. If either number is missing the cell shows a dash.
Step 3: Record a set of vitals
Select Record vitals, either on the Flowsheets tab or on the Summary's Vital Signs card.
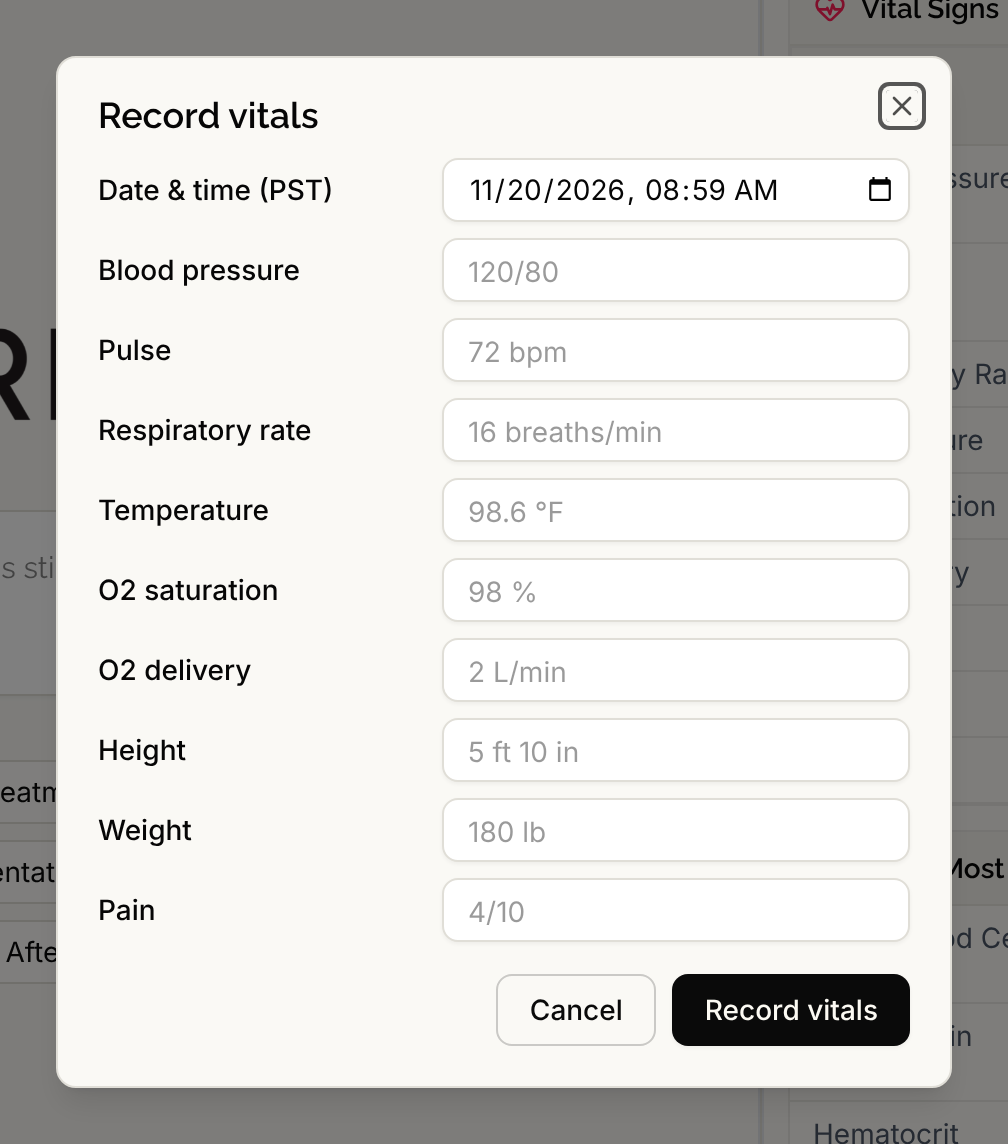
Check the Date & time field, which is set to now in the clinic's time zone. Type a value for each vital you took and leave the others blank. Select Record vitals to save them all as one column.
These formats are accepted:
- Blood pressure as
120/80. - Temperature such as
98.6, with or without °F or °C. A number alone is read as Fahrenheit. - Height such as
5'10",70 inor178 cm. A number alone is inches. - Weight such as
180 lbor81.6 kg. A number alone is pounds. - Pain as a whole number from 0 to 10, or
4/10.
If a value cannot be read, the form shows what was wrong and the formats that work, and saves nothing. You must enter at least one value, and the time cannot be in the future.
Step 4: Add or correct a value in the grid
You can also work in the grid itself. Select an empty cell, type the value and press Enter. Escape or clicking away discards it.
To fix a reading, select the cell and choose Add correction. Type the right value and press Enter. The correction is added as a new reading at the same moment, and the original stays in the claim's history. Choose View claim to see that history. A cell with an earlier value in the same minute is marked, and its accessible name says so.
The grid does not mark values as high or low. The Summary card tints values outside the usual adult range, and the grid shows plain values.
Notes
- Readings that have only a year or month recorded cannot be placed in a column. The tab says how many were left out and points you to the Summary's vital history, where you can open them.
- Selecting a vital's name on the Summary opens its history, with an Add measurement form.
- A change made anywhere updates an open grid without a reload. See Live Chart Updates.